Local Market area statistic breakdowns up-to-date 2018:
Historic Downtown Charleston,
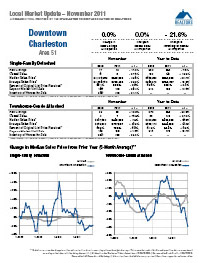
Downtown Charleston
Upper Peninsula
Mount Pleasant
(Lower-South),
Mount Pleasant (Upper-North),
Sullivan's Island
and
Isle of Palms
James Island,
Greater Summerville,
West Ashley,
Folly Beach,
Kiawah Island
and Seabrook Island
North Charleston
and
Greater Summerville
Please email me if you would like information on any
of the hyper local markets. If you don't see the area you are
interested in here, we can create a report for you.
charlestonaddress.com@yahoo.com or 843-568-0595
CHARLESTON, SC—(February, 2018) Mortgage rates are on the rise. When this happens, it means that buyers
in the lower-priced categories tend to have the dilemma of choosing to
pay more for their desired home, paying less to get less, waiting for more
listings or saving more money toward a downpayment. For the 12-month
period spanning March 2017 through February 2018, Pending Sales in the
Charleston-Trident region were up 3.0 percent overall. The price range
with the largest gain in sales was the $300,001 and Above range, where
they increased 12.3 percent.
The overall Median Sales Price were up 5.4 percent to $254,500. The
property type with the largest price gain was the Single-Family Homes
segment, where prices increased 6.8 percent to $272,500. The price
range that tended to sell the quickest was the $150,001 to $200,000 range
at 35 days; the price range that tended to sell the slowest was the
$300,001 and Above range at 78 days.
Market-wide, inventory levels were down 10.6 percent. The property type
that lost the least inventory was the Single Family segment, where it
decreased 9.3 percent. That amounts to 3.2 months supply for Single-
Family homes and 2.9 months supply for Condos.
Find Berkeley County area reports here.
Charleston County
865 homes sold at a median price of $318,345 in July in Charleston County. There are currently 2,988 residential properties for sale in Charleston County.
Find Charleston County area reports here.
Dorchester County
302 homes sold at a median price of $199,450 in Dorchester County in July. There are currently 938 residential properties for sale in Dorchester County.
Source: Charleston-Trident MLS
Questions about Charleston area real estate and homesites
for sale?
Any questions? If you have any questions about Charleston
Real Estate Market trends, we have a comprehensive report,
produced periodically, that we can send you.
Please contact us with any other questions about Charleston
real estate.
Charleston Real EstateArchived Real Estate Articles
A look back...
Charleston
Market Report Article January 2006
Charleston
Market Report Article October 2005